
| Version 11 (modified by tshalif, 14 years ago) (diff) |
|---|
Table of Contents
How to use
Device Tilt
The device must be attached to the boat facing the rower, with the screen tilted slightly upwards and back. The application will not work with a forward tilt, nor with a more than 180 degree tilt backward.
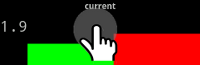
Distance/Speed? precision
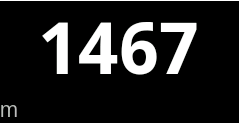
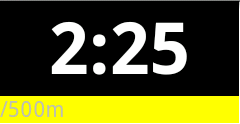
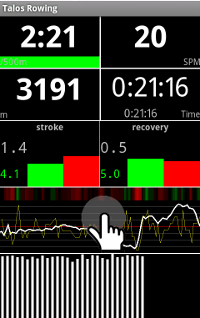
The application is programmed to update the distance and speed values by increments of 40m. Depending on the GPS reception quality, the figures shown may be anything between 'quite precise' to 'very inprecise'. The colour of the bar underneath the speed display will be coloured green for best precision, red for worst.
Graph Zooming
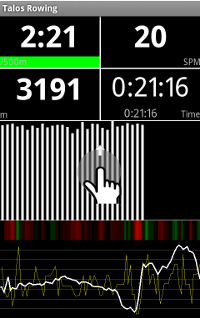
Due to device screen size limitations, not all graphs may be viewed at the same time. Currently up to 3 graph views may display simultaneously. Toggling the number of graphs is done by double tapping on any graph.
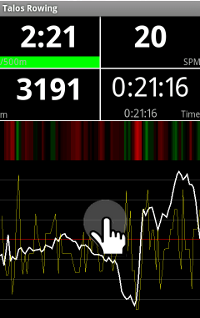
Graph Switching
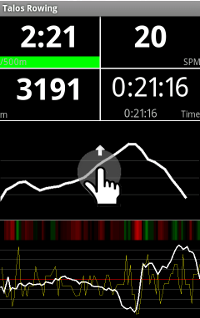
An upward fling on a graph will replace it with another graph not currently shown.
Recording/Replaying?
It is possible to record a rowing session for later replay/analysis.
Recording
Session recording will start whenever the Record Session option in the application preferences is checked:

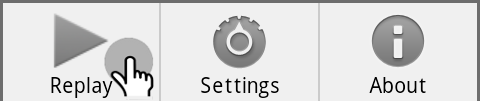
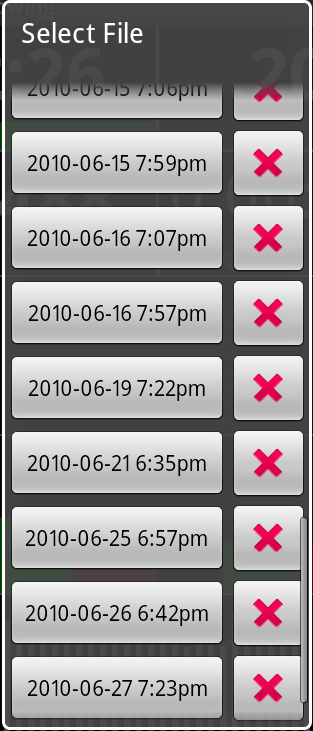
Replaying
To replay a previously recorded file, go to the context menu and choose a previously recorded file for replay. Fast forward/rewind is possible during replay by right/left flinging motion inside any of the graph areas.
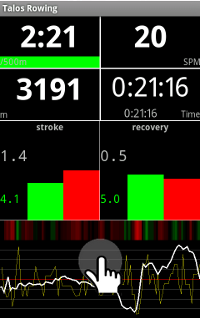
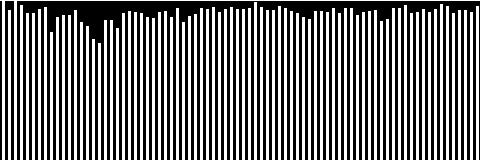
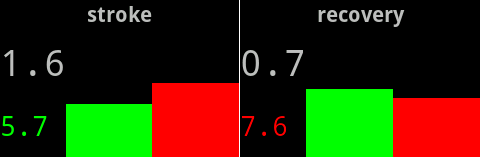
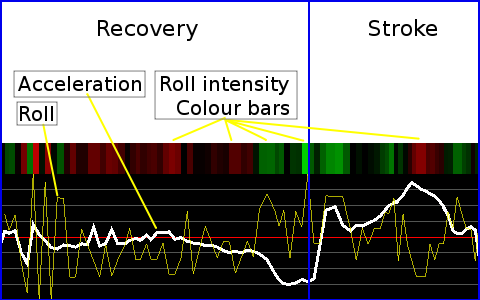
Stroke analysis graphs
- stroke power bars:
- continuous stroke/recovery/roll graph:
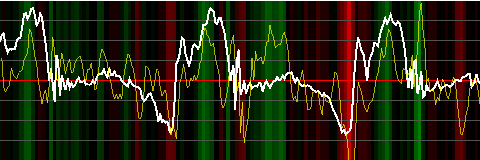
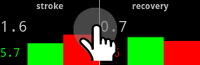
- stroke/recovery roll bars:
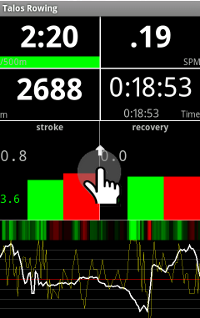
It is further possible to toggle the display of the roll view by a single tap on it:
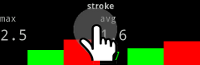
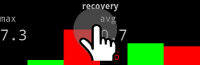
- last stroke/recovery analysis graph:
heart rate (Zephyr device required):